Getting Started
To get started with SeisScan, we can follow the example below. This script demonstrates how to read example data, extract event information, and plot a record section.
[1]:
from obspy import UTCDateTime
import seisscan as ss
Read SeisScan Example data
We shall use an example dataset returned by seisscan.read_example function. The dataset contains event informatin (Quinones, 2021), waveform stream and station metadata from IRIS fullwaveform experiment in Oklahoma (Sweet et al., 2018).
[2]:
event_dict, st, inventory, subnetworks, model_name = ss.read_example()
Extract the event information.
[3]:
evt0 = UTCDateTime(event_dict["evt0"])    # event origin time
evlo = event_dict["evlo"]                 # event longitude
evla = event_dict["evla"]                 # event latitude
evdp = event_dict["evdp"]                 # event depth (km)
mag = event_dict["mag"]                   # event magnitude
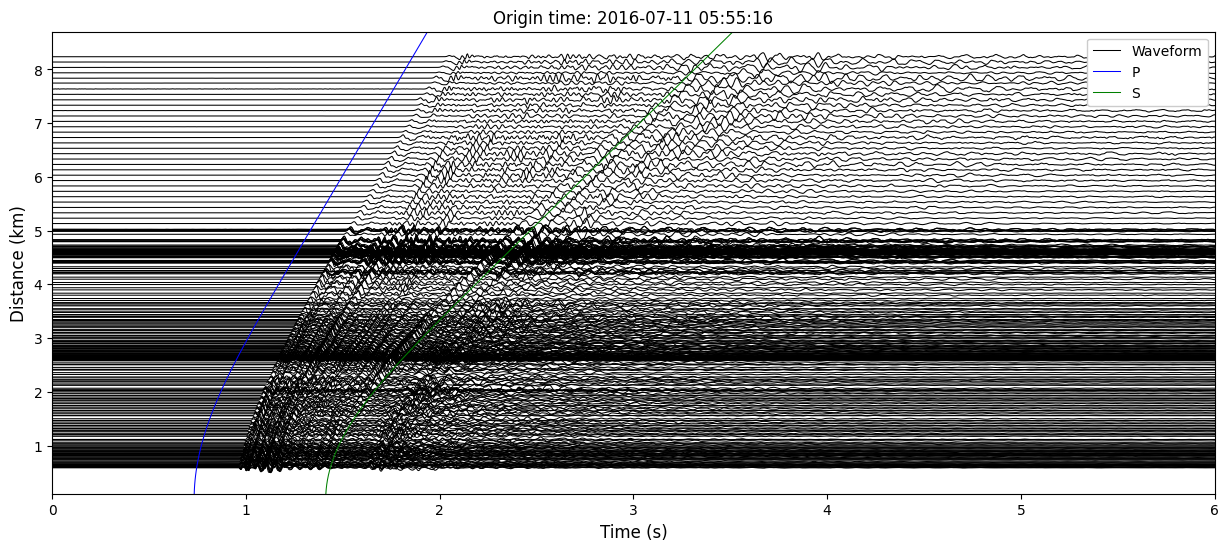
Plot record section
Plot a record section of the stream using seisscan.prs function.
[4]:
ss.prs(st.select(channel="DPZ"),
        evt0, evlo, evla, evdp, scale=0.1, model_name=model_name,
        xmin=0.0, xmax=6.0, width=15, height=6)
References
Quinones L. 2021. Tracking induced seismicity in the Fort Worth Basin, Texas and Northern Oklahoma using local and large‐N style arrays, Earth Sci. Theses and Dissertations 22 , available at https://scholar.smu.edu/hum_sci_earthsciences_etds/22.
Sweet J. R. Anderson K. R. Bilek S. L. Brudzinski M. Chen X. DeShon H. Hayward C. Karplus M. Keranen K., and Langston C., et al. 2018. A community experiment to record the full seismic wavefield in Oklahoma, Seismol. Res. Lett. 89, no. 5, 1923–1930, doi: https://doi.org/10.1785/0220180079.